
Field notes
Breaking the $5M Ceiling: What Unblocks D2C Growth
August 4, 2026

Picture the version of this you have probably lived. Revenue up 14% year on year. Meta ROAS holding somewhere around 2.4. Email driving a healthy share of orders. A repeat rate the founder is happy to quote. The team has done everything the playbooks say. Flows are built. The PDP has been through two rounds of testing. Creative gets refreshed on a cadence.
The problem is that the brand has been doing 14% for three years, headcount has roughly doubled over the same period, ad spend has grown faster than revenue, and cash conversion has gotten worse every quarter. From the dashboard, the business looks like it is working. From the bank account, it looks like a treadmill.
That is what the $5M ceiling actually feels like. Not a wall. A slow increase in the amount of effort required to hold the same growth rate, until the effort exceeds what the team and the balance sheet can supply. The tactics did not stop working. The constraint moved, and nobody re-ran the diagnosis.
TL;DR
- Growth in the $5M to $20M band is currently being bought, not earned: across Northbeam's dataset, brands in that band grew spend and revenue together while MER and CAC both moved the wrong way.
- Blended metrics let returning customers cover for a shrinking new customer engine. Split first-time and returning cohorts or you will not see it until it is structural.
- The binding constraint at this size is usually contribution margin per order, not CAC. Margin compounds into every future acquisition decision. CAC wins do not.
- Assortment sprawl and app stack creep are the two costs that arrive quietly and scale with you. Bain's work on simplification puts the prize at 2 to 5 points of sales growth and 100 to 400 basis points of margin.
- Diagnose which of four constraints binds before spending another dollar. Working the wrong one is the actual reason brands stall.
The ceiling is arithmetic, not ambition
Under roughly $3M, a D2C brand is usually harvesting a pocket of unusually cheap demand: an underpriced audience, a founder's own following, an early product advantage, a channel arbitrage that has not closed yet. Growth in that phase is mostly a matter of pouring more into a channel that keeps returning more than it takes.
Somewhere past that, the pocket empties. What is left is the ordinary auction, and the ordinary auction is not getting cheaper. Meta's own annual filing reports that the average price per ad rose 9% in 2025, on top of a 10% rise in 2024, while impressions delivered grew 12%. Those are Meta's blended global numbers across every advertiser and objective, so they understate what a US D2C brand bidding on purchase conversions experiences, but the direction is unambiguous and it comes straight from Meta's 10-K.
Northbeam's read of its own 2025 dataset is the sharpest confirmation we have seen for this specific band. Aggregate ad spend rose about 15% while revenue rose about 14%. Median MER fell just over two percentage points. Median first-time CAC rose nearly 9%. And in the $5M to $20M cohort specifically, spend and revenue both rose while MER and CAC moved the wrong way. Read that carefully: the brands in this band bought their growth at a worse price than the year before.
That is the ceiling. Not a lack of demand. A worsening exchange rate between dollars in and revenue out, against a cost base that is now fixed.
Returning customers are hiding your acquisition problem
Here is the failure mode that catches sophisticated operators, because it only shows up in metrics they trust.
Blended MER, blended ROAS and total revenue are all composites of two very different businesses. One is acquisition, which is expensive and getting more so. The other is retention, which is cheap because you already paid for the customer. As your customer file ages, the retention half grows as a share of revenue by simple arithmetic. So blended efficiency can look flat or even improve while the acquisition engine underneath it is shrinking.
Northbeam names this directly: returning customers have been masking weaker acquisition economics, and growth that rests on deteriorating new customer economics is not durable. It is not durable because the retention half is a function of the acquisition half, on a lag. A file that stops being refreshed decays, and the decay shows up 12 to 18 months after the acquisition problem started.
The fix is a reporting discipline, not a tool. Split every efficiency metric you care about into first-time and returning, and chart the first-time series on its own for at least 12 months. If you are still running on blended numbers, our post on MER versus ROAS covers the measurement layer, and the DTC finance dashboard piece covers what belongs on the daily view.
The leak stack nobody models end to end
Operators model acquisition carefully and model everything after the click loosely. The compounding effect of the stages after the click is larger than most of the CAC optimization work that gets prioritized above it.
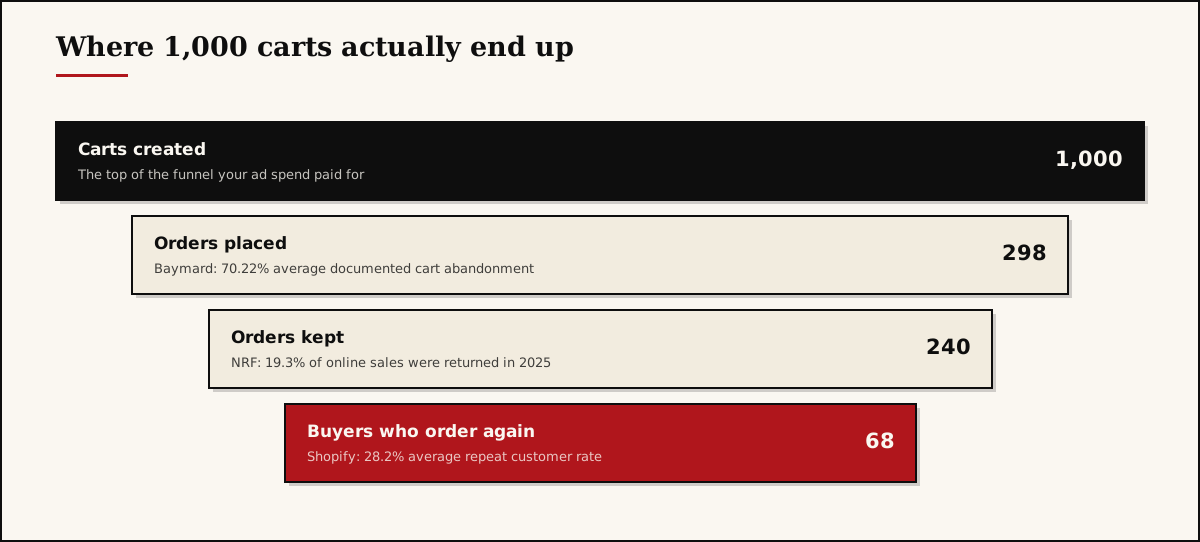
Baymard Institute's aggregate of 50 studies puts the average documented cart abandonment rate at 70.22%. Excluding people who were only browsing, the top stated reasons are extra costs at 40%, slow delivery at 20%, payment security distrust at 19%, forced account creation at 18% and a long checkout at 17%. Those are largely design and policy decisions, not customer defects.
The NRF's 2025 returns research puts the online return rate at 19.3% of sales, against 15.8% across all retail, with total returns near $850 billion and 9% of returns fraudulent. And Shopify's own benchmarking puts the average repeat customer rate at 28.2%, with wide category variance.
Multiply those through and the picture changes. A cart is worth a fraction of what the acquisition model implies, and every point recovered in the middle stages is worth more than a point of CAC because it applies to the whole file, not just the next cohort. The related work here is our checkout friction audit and returns policy posts.
Assortment sprawl is the growth tax operators refuse to name
Between $5M and $20M, almost every brand adds SKUs. New colorways, a line extension, a bundle, a seasonal drop, a collaboration. Each one is defensible in isolation. Collectively they create a cost structure that nobody budgeted for: inventory cash tied up in slow movers, photography and page builds, more support tickets, more forecasting error, more merchandising decisions per week.
Bain's research across consumer goods portfolios found that reducing SKU complexity can increase sales growth by 2 to 5 percentage points and margins by 100 to 400 basis points, with examples of categories growing while cutting a large share of their items. Bain also makes the important qualification: in premium categories, novelty and choice can be part of the loyalty mechanism, so the pruning logic is category dependent rather than universal.
The diagnostic is simple and most brands have never run it. Rank every SKU by contribution dollars rather than revenue. Include the inventory carrying cost and the return rate per SKU. Look at the bottom half. If the bottom 50% of your catalog produces under 10% of contribution, you are funding it with the good half.
The cost base you bought at $5M is priced for $20M
The second quiet cost is the stack. Most of the tools a D2C brand adds between $2M and $10M price on volume or GMV, which means the bill grows with you whether or not the tool is still changing decisions.
| Tool | Published price | When it is the wrong choice |
|---|---|---|
| Triple Whale | Foundation $219/mo, Automate $749/mo, tiered by annual GMV | You have one meaningful paid channel and no incrementality testing budget. A well-built spreadsheet answers the same questions until roughly $10M. |
| Postscript | Growth $100/mo, Professional $500/mo, plus roughly $0.007 to $0.015 per SMS and carrier fees around $0.00418 | Your list is under a few thousand engaged subscribers, or your AOV cannot carry the per-message cost. SMS punishes low margin catalogs. |
| Loop Returns | Essential $155/mo, Advanced $272/mo | Return volume is low or returns are already routed through a 3PL portal. Automating a small returns flow buys convenience, not margin. |
| Gorgias | Priced by ticket volume from 50 to 5,000 tickets per month, with AI resolutions billed per resolved conversation | Ticket volume is a product or policy symptom. Deflecting tickets you should not be generating hides the underlying defect. |
| Klaviyo | Usage based, quoted by active profile count and message volume | You are paying for profiles you never mail. Suppressing and pruning the inactive tail is the single most common unbooked saving at this size. |
None of these are bad products. Triple Whale and Klaviyo in particular do real work at scale. The point is that the stack is a recurring cost that indexes to your growth, and almost nobody re-audits it. Run the test annually: name the specific decision each tool changed in the last two quarters. Anything without an answer is a subscription, not a system. We covered the app economics angle in upsell and cross-sell apps compared.
Four constraints, and only one of them binds
The reason brands stall is rarely that they did nothing. It is that they worked on a constraint that was not binding. There are four candidates and at any moment one of them is the limiting factor.
| Constraint | Symptom | What actually moves it |
|---|---|---|
| Demand | Spend increases produce sub-linear revenue; frequency climbs; first-time CAC rises fastest | New audience or new channel, new offer, new geography |
| Conversion | Traffic is stable, revenue is not; cart and checkout drop-off above category norms | Checkout, PDP, pricing presentation, delivery promise |
| Margin | Revenue grows, cash does not; discounting is structural; returns eat the gain | Price architecture, COGS, assortment pruning, returns policy |
| Capacity | Everything is a bottleneck; the team is the roadmap; decisions queue | Hiring, process, owning fewer things well |
Two rules make this useful. First, only one binds at a time, and relieving it moves the constraint somewhere else, which is the point. Second, the binding constraint is usually not the one your team is best at. Marketing-led brands diagnose demand problems. Operations-led brands diagnose capacity problems. Both are pattern matching on their own competence.
If demand is genuinely the constraint, the channel question is a real one, and our Amazon versus D2C channel math and wholesale launch posts work through the economics. If capacity is the constraint, first ten hires is the more relevant read.
Our take
Three positions, and we will argue each from mechanism.
Fix contribution margin before you touch CAC. Margin is a multiplier on every future acquisition decision; CAC is a single trade you have to re-win every quarter. If you improve contribution margin per order by two points, you have permanently raised the CAC you can profitably pay, which expands the set of ad inventory and audiences that clear your bar. That expansion is what actually unlocks spend. Improving CAC by two points, against a fixed margin, buys you a better quarter and then the auction takes it back, as the 2025 data shows it did. Most brands at this size have never priced-tested seriously, have never modeled the margin cost of their free shipping threshold, and have never pruned the catalog. Those are bigger levers than another round of creative testing.
We disagree with the standard advice to diversify channels at $5M. A new channel adds fixed cost, a new set of unit economics, and a claim on the scarcest resource in the business, which is founder and operator attention. It is a good move when your primary channel is genuinely saturated, meaning incremental spend produces sub-linear revenue that you have actually tested for, and when your margin can absorb a marketplace or retailer take rate. Both conditions are rarer than the advice implies. Most brands that add a channel at $5M are avoiding a margin conversation, and they discover eighteen months later that they now have two unprofitable channels instead of one.
A better data stack does not break the ceiling, and often delays the decision. At $2M to $20M, an attribution platform priced on GMV rarely surfaces a decision that contribution margin per SKU and a split of first-time versus returning cohorts would not have surfaced first. Buy measurement when you have a specific budget allocation decision worth more than the tool, and when you are prepared to run holdouts. Otherwise you have bought a more precise view of a business whose economics you have not fixed. The 2025 data is a good illustration: the brands that grew spend hardest were also the ones whose efficiency fell furthest. Better dashboards would not have changed that. Better margin would have.
What to do this week
- Rebuild your top-line report to split first-time and returning revenue, CAC and MER, and chart the first-time series alone for the last 12 months.
- Rank every SKU by contribution dollars including carrying cost and return rate, then list the bottom 50% and total what they contribute.
- Pull the last 12 months of app and platform invoices into one sheet, and next to each line write the specific decision that tool changed in the last two quarters.
- Measure your own cart abandonment and return rate against the 70.22% and 19.3% benchmarks, then fix the top stated reason you can control, which is usually extra costs shown late.
- Pick one constraint out of demand, conversion, margin and capacity, write down the evidence it is binding, and commit the next quarter's work to it alone.
If you want a second set of eyes on which constraint is actually binding in your business, that is the conversation we have most often. Book a call and we will work through your first-time cohort economics and contribution margin with you, or start with a free audit if you would rather see our read before you talk to anyone. For a defined scope of work, request a custom quote.
Frequently asked questions
It is real in the sense that the mechanics of the business change around that revenue level. The cheap pocket of demand is exhausted, fixed costs are locked in, and blended metrics start hiding a deteriorating new customer picture. The number varies by category, but the pattern is consistent enough to plan against.
Contribution margin, almost always. Margin is a multiplier on every future acquisition decision. Two points of margin permanently raises the CAC you can afford, which widens the pool of profitable ad inventory. Cutting CAC by the same amount is a one-off win you have to re-earn every quarter.
Split your revenue and your marketing efficiency into first-time and returning cohorts and chart them separately for 12 months. If blended MER is flat while first-time MER declines, returning revenue is carrying the business and your acquisition engine is quietly shrinking.
Rarely on its own. A new channel adds fixed cost, management attention and a second set of unit economics before it adds meaningful revenue. It works when your existing channel is genuinely saturated and your margin structure can absorb the new channel's take rate. It fails when it is used to avoid a margin problem.
Less than most do. The test is whether a tool changes a decision you would otherwise get wrong. Attribution platforms priced on GMV, returns platforms and SMS platforms all scale their cost with your growth, so audit the stack annually and cut anything that has not driven a decision in two quarters.
Rank every SKU by contribution dollars, not revenue, and look at the bottom half. If the bottom 50% of SKUs generates under 10% of contribution while consuming inventory cash, photography, page builds and support volume, complexity is your binding constraint.
One-page resource
Get the Small Store Revenue Checklist.
The 12 things that actually move revenue on a store under $50K a month, in the order we'd fix them. Delivered to your inbox.