
Field notes
The D2C Data Stack at $5M: Buy, Build, or Skip
August 5, 2026

A brand doing $5.2M on Shopify asked us to look at why their Monday numbers never matched. Their Meta account claimed $412,000 of attributed revenue in the prior 30 days. Shopify's own marketing reports credited Meta with roughly half of that. Their attribution app landed somewhere in between, and their bookkeeper had a fourth number that came from the bank.
Nobody was wrong. Meta was counting view-through conversions on its own terms. Shopify was applying last click with a cookie-based session model. The app had its own pixel and its own window. Four systems, four defensible methodologies, four different answers to a question the founder needed settled before signing off on next quarter's budget.
They did not have a tracking problem. They had a stack that had grown by accretion: an app added during a Black Friday panic, a tag added by an agency that had since been replaced, a spreadsheet maintained by whoever had the time. This is what most $2M to $20M brands look like inside, and it is fixable in about six weeks without hiring anyone.
TL;DR
- Marketing budgets are flat at 7.7% of company revenue, so a data stack has to justify itself against media, not against a line item nobody defends.
- Buy tracking reliability and ingestion. Build definitions and the reporting layer. Skip enterprise CDPs, MMM, and a second attribution vendor.
- Attribution tools tell you where credit lands. Geo experiments tell you what happens if you stop spending. Only the second one changes a budget decision.
- A working stack at $5M costs roughly $700 to $1,600 a month, most of it in tracking reliability and BI, not in the warehouse.
- The most expensive mistake at this size is buying a measurement product before fixing event collection, which guarantees you pay a premium for the same broken inputs.
What a data stack has to do at this size
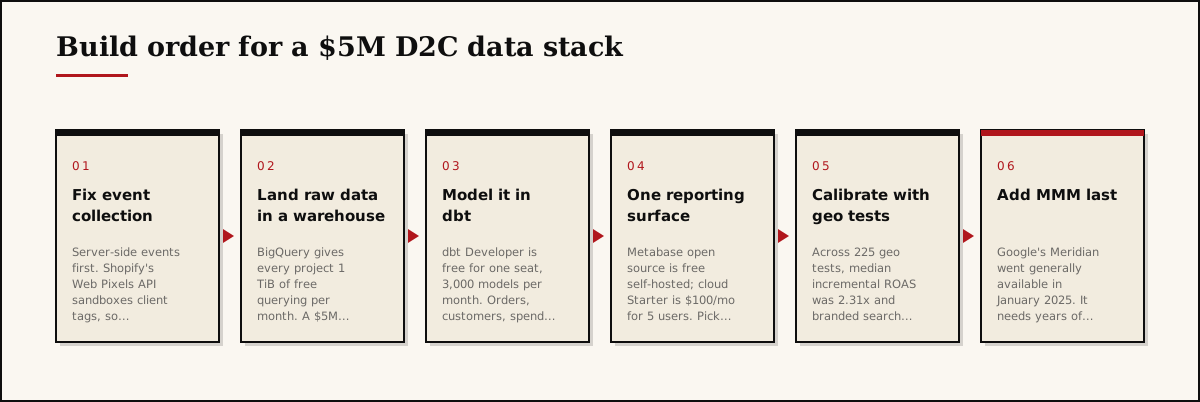
Three jobs, in order. Collect events reliably. Join spend, orders, cost and returns into one modeled table. Answer causal questions about where the next dollar goes. Every tool you are being sold claims to do all three. Almost none do more than one well.
The failure mode is that brands buy for job three while job one is broken. Shopify's Web Pixels API runs app and custom pixels in sandboxed environments with controlled access to cookies and storage, which is good for privacy and bad for the assumption that a tag you pasted in 2023 is still capturing what you think. Meanwhile Shopify's own marketing reports offer five attribution models, default to last click on sales reports, and reset the first-touch referrer if a visitor does not purchase within 30 days. That is a reasonable design. It is also a specific set of choices that will never agree with Meta's.
What to buy
Buy the things where the failure cost is high and the build cost is real: event collection, ingestion, and one BI surface you can actually run a business from.
| Layer | Tool | Cost | When it is the wrong choice |
|---|---|---|---|
| Server-side events | Elevar | $225/mo to 2,000 orders, $650/mo to 10,000, $1,250/mo to 30,000 | You are under 500 orders a month and can live with client-side tagging plus native Meta and Google integrations |
| Ingestion | Fivetran | Usage-based on monthly active rows, with a $5 base charge per standard connection | Your only sources are Shopify, Meta and Google, all of which have free or near-free native exports into BigQuery |
| Transformation | dbt | Developer free (1 seat, 3,000 models/mo), Starter $100 per seat/mo | Nobody on the team writes SQL and nobody will, in which case you are buying a hosted BI tool instead |
| BI | Metabase | Open source free self-hosted, cloud Starter $100/mo for 5 users, Pro $575/mo | You need embedded, multi-tenant reporting for wholesale partners, which pushes you to Pro pricing fast |
| All-in-one | Triple Whale | Starter $179/mo, Advanced $259/mo, Professional $749/mo, banded by GMV | Finance already reconciles against Shopify and the ad platforms, so you are paying a revenue-scaled fee for a fourth opinion |
Two notes on that table. Triple Whale and Polar Analytics both price against annual GMV, which means the tool gets more expensive precisely as your internal capability improves. That is fine for two years and irritating by year three. And every one of these vendors prices the warehouse layer as if storage were the expensive part. It is not. BigQuery gives each project 1 TiB of free querying per month, and a $5M store's complete order, customer and event history is small data by any modern definition.
What to build
Build the semantic layer. This is the part no vendor can sell you, because it encodes decisions only you can make.
Specifically: what counts as a new customer, whether a subscription renewal is revenue or retention, how you allocate shipping cost per order, what date a return reverses, whether gift cards are revenue on sale or on redemption, and which channel owns an order that touched four. Get those defined once, in version-controlled dbt models, and every downstream number agrees by construction. Skip it and you will keep having the meeting where three people defend three spreadsheets.
Build your own contribution margin model too. Platform ROAS and even blended MER are proxies for a number you can compute directly: revenue minus COGS, minus fulfillment, minus payment fees, minus discounts and returns, minus media, by acquisition cohort. We go deeper on the metric set in the D2C finance dashboard and on the ratio itself in MER versus ROAS.
What to skip
Enterprise CDPs. At $5M your customer profiles already live in Klaviyo and Shopify, and you have maybe four activation destinations. A CDP solves an identity problem you do not have yet. Spend the money on profile properties done properly instead.
A second attribution vendor. Adding one more pixel to adjudicate between the pixels you already have does not converge on truth. It adds a fourth number and a monthly invoice.
MMM. Google's Meridian became generally available in January 2025 and it is genuinely good work, but it is a Bayesian model that wants years of weekly history, real variation in spend, and calibration from live experiments. Running it on 18 months of data where spend only ever went up produces a confident-looking answer with no information in it.
Real-time dashboards. Daily refresh at a fixed time creates a stable artifact people can argue about. Real-time creates the temptation to react to noise, which is how a good creative gets killed on day two.
The layer almost everyone gets wrong
Attribution tools answer "where did credit land." That is a bookkeeping question. The budget question is "what happens to revenue if I turn this off," and no pixel can answer it, because a pixel cannot observe the counterfactual.
Geo holdout testing can. And the results are consistently uncomfortable. Across 225 geo-based incrementality tests run between August 2024 and December 2025 on D2C brands (90% of them on Shopify), median incremental ROAS came in at 2.31x. Meta sat at 2.92x, Google Performance Max at 2.98x, and Google branded search at 0.70x. The authors are explicit that their sample skews to brands who opt into testing and suggest discounting by 15% to 25% for a typical advertiser.
Sit with the branded search figure. Every attribution model in your stack will hand branded search a large share of credit, because it sits closest to the purchase. A holdout suggests most of that demand arrives anyway.
The market has noticed. In a July 2025 study of 196 US marketing professionals, TransUnion and EMARKETER found that 62% have only some confidence in their performance metrics, 60% say internal stakeholders question metric validity at least sometimes, and 29% report that up to a fifth of their budget has been reallocated or put at risk by measurement doubt. Meanwhile 67% now prioritise incremental ROI. Confidence has stalled while spend on measurement rises, which is what happens when brands buy more reporting instead of more evidence.
If you have not run a geo test, the sizing math is the same as any experiment, and our note on sample size applies directly.
What it actually costs
| Configuration | Monthly | Best for |
|---|---|---|
| Lean: native integrations, BigQuery, dbt Developer, Metabase self-hosted | Under $150 | Founder-led team with one SQL-literate person |
| Standard: Elevar Core, BigQuery, dbt Developer, Metabase Starter | Roughly $450 | 1,500 to 2,000 orders a month, one analyst-ish operator |
| Standard plus experimentation: add quarterly geo tests | $700 to $1,600 | Spending over $100k a month on media |
| Convenience: Triple Whale Advanced or Professional, no warehouse | $259 to $749 | You need answers this month and have no internal capability |
The convenience row is not a joke. It is a legitimate choice for twelve to eighteen months. It is only a bad choice when it becomes permanent, because the fee scales with your GMV while its usefulness does not.
Our take
Most agencies will tell you to buy the attribution platform. We think that is backwards at this revenue band, and here is the mechanism.
An attribution tool changes how credit is distributed among channels you are already running. It does not change the total. If your blended contribution margin is thin, redistributing credit between Meta and Google cannot fix it. What can fix it is discovering that a channel you are funding is not incremental, and only an experiment tells you that. So the correct first purchase is not a measurement product. It is reliable event collection plus the discipline to run one holdout a quarter.
The second, less popular position: at $5M you should deliberately underbuild the reporting layer. Every extra dashboard raises the probability that two of them disagree, and disagreement is what erodes trust in data. One modeled source, one BI tool, five dashboards nobody can add to without a review. Constraint is the feature.
Third, and this is where we disagree with the prevailing advice most sharply: do not buy a tool to compensate for an unowned definition. If nobody in the business can say what a new customer is without checking, no vendor will resolve it, because they will just apply their own default and you will inherit an opinion you never chose. The definitions are the asset. The software is rented.
Where we agree with conventional wisdom: server-side collection is worth real money. It is the one layer where the failure is silent, compounding, and invisible on a dashboard. Everything downstream inherits its errors, which is why we put it first in the build order and why we treat it as non-negotiable in a growth retainer. The wider server-side setup is covered in GA4 and server-side analytics.
What to do this week
- Pull the last 30 days of attributed revenue from Shopify, Meta, Google and any attribution app into one sheet and write down the gap in dollars. That number is your business case.
- Audit which pixels and tags are actually firing on your checkout under Shopify's Web Pixels sandbox, and delete every tag whose owner you cannot name.
- Pick a single attribution model as the house standard for reporting, document it, and stop reconciling against the others.
- Write down your definitions for new customer, returning customer, net revenue and contribution margin, then get one person to own them.
- Scope one geo holdout for your largest channel, or for branded search if you have never tested it, and book it for next quarter.
If you want a second pair of eyes on where your stack leaks money, book a 30-minute call and we will walk through your actual numbers rather than a template. If you already know the shape of the work, request a custom quote, or start with a free audit and we will tell you which layer to fix first.
Frequently asked questions
Usually yes, but not for the reason people assume. It is not about volume. A $5M store's full order history fits comfortably inside BigQuery's free monthly query allowance. It is about having one place where marketing spend, orders, COGS and returns can be joined without a person exporting spreadsheets every Monday.
It is worth it when nobody on the team can write SQL and you need a credible daily view tomorrow. It stops being worth it when your finance team is already reconciling its numbers against Shopify and your ad platforms, because you are then paying a GMV-scaled fee for a second opinion you do not act on.
As a planning number, one to two percent of revenue across tracking, warehouse, transformation, BI and testing. Below that you are usually flying on platform-reported numbers. Above that at this size you are normally paying for seats and dashboards nobody opens.
Almost never as a first move. MMM needs years of weekly history, real spend variation and calibration from live experiments. Geo holdout tests give you a cleaner answer at this size, faster, and they are the input that makes an MMM trustworthy later.
Paying two or three vendors to answer the same attribution question. Most brands at this size run Shopify reports, an attribution app and their ad platforms in parallel, then argue about which is right instead of running one experiment that would settle it.
Yes at this size. Managed ingestion, dbt and a hosted BI tool cover the work in roughly a day or two a month once built. What you need is someone who owns the definitions, not someone who babysits pipelines.
One-page resource
Get the Small Store Revenue Checklist.
The 12 things that actually move revenue on a store under $50K a month, in the order we'd fix them. Delivered to your inbox.