
Field notes
Demand Planning for D2C: Forecasting Without Cash Crunch
July 29, 2026

A skincare brand doing about $9M a year runs a spring promotion that overperforms. The hero serum sells eleven weeks of cover in nine days. The team reacts the way most teams react: they place a large replenishment order, and because the factory offers better unit economics at volume, they round it up. Twenty-two weeks of cover on the serum, plus opportunistic top-ups on four adjacent SKUs while the purchase order is open.
Four months later the serum is fine. The four adjacent SKUs are not. They are sitting on 40 weeks of cover, the brand is short on cash going into its heaviest ad quarter, and the only lever left is a sitewide discount that trains the list to wait for sale prices. Nothing about the forecast was wrong. The serum genuinely did sell. The failure was that the forecast was treated as a prediction exercise instead of a capital allocation exercise.
This is the pattern we see repeatedly in brands between $2M and $20M. They do not have a forecasting problem. They have a problem connecting a forecast to a buy decision under a cash constraint, with lead times that move and minimum order quantities that do not.
TL;DR
- The forecast is an input. The deliverable is a purchase order that respects cash, minimum order quantities and lead time variance.
- Segment SKUs by demand variability and lead time, not by revenue. Revenue ranking tells you what matters, not what is hard to plan.
- Service level is a cash decision. Moving from 95 to 99 percent availability raises your safety stock multiplier from 1.65 to 2.33.
- Lead time variance now contributes more error than demand variance for most importing brands. Ocean schedule reliability sat at 62.2 percent in March 2026.
- Measure forecast bias before forecast accuracy. Persistent bias is a process problem and is far cheaper to fix.
The forecast is an input, not the deliverable
Shopify's native inventory reporting gives you "days of inventory remaining", calculated as ending quantity divided by average units sold per day over the last 28 days (Shopify Help Center). That number is useful and it is also the single most misused figure in D2C operations, because it is a naive extrapolation of a four week window with no seasonality, no promotional calendar and no lead time.
The correct chain is longer. Demand forecast, minus expected returns, plus safety stock derived from your target service level, minus stock on hand and stock on order, rounded to the supplier's minimum order quantity, constrained by available cash in the period the deposit falls due. Every one of those steps can dominate the answer. In practice, on brands at this size, the cash and MOQ constraints dominate more often than the forecast does.
The practical consequence: if two forecasting methods produce buy quantities that round to the same MOQ, the difference between them is worth nothing. Spend the effort on the SKUs where a better forecast actually changes the order.
Segment by variability, not by revenue
Most brands segment inventory by revenue contribution, which is fine for merchandising and useless for planning. A SKU that sells 400 units a week with a coefficient of variation of 0.15 needs almost no attention. A SKU that sells 90 units a week with a CV of 0.9 and a 110 day lead time will eat your working capital and your Saturdays.
Segment on two axes instead:
| Segment | Demand variability | Lead time | Planning approach |
|---|---|---|---|
| Core | Low (CV under 0.3) | Any | Statistical reorder point, review monthly |
| Volatile | High (CV over 0.6) | Short | Smaller, more frequent buys, higher review cadence |
| Exposed | High | Long (over 90 days) | Scenario planning, consider dual sourcing or air split |
| Tail | Any | Any, low volume | Make to order, bundle out, or discontinue |
Coefficient of variation is standard deviation of weekly units divided by mean weekly units. Compute it over 26 weeks, excluding promotional spikes into a separate promo uplift factor. If more than about a fifth of your SKUs land in "Exposed", the fix is a sourcing decision, not a forecasting one. No model will make a 110 day lead time on a volatile SKU comfortable.
Service level is a cash decision
Safety stock is conventionally set as a service level multiplier (the z-score of your target in-stock probability) times the standard deviation of demand over lead time. The multipliers are fixed by the normal distribution, and they are non-linear in a way that most operators underestimate.
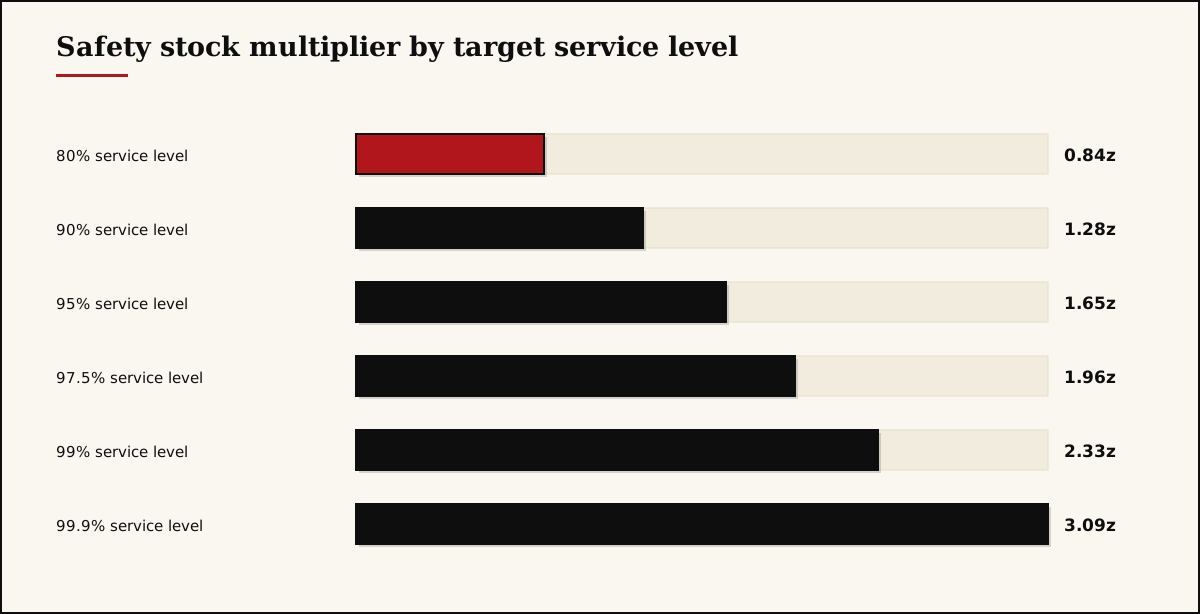
Read that chart as a price list. Going from 90 to 95 percent availability costs you 29 percent more safety stock. Going from 95 to 99 percent costs another 41 percent on top. Going from 99 to 99.9 percent costs a further 33 percent to buy back one tenth of one percent of availability.
Almost no D2C brand should run 99 percent across the catalogue. A defensible policy looks like 97.5 percent on the two or three SKUs that anchor acquisition and subscription, 95 percent on the rest of the core range, 85 to 90 percent on the tail, and an explicit decision to accept stockouts on seasonal or limited items. Write the policy down. If it is not written down, the default becomes "whatever the person placing the order was worried about that week", and that default is expensive.
One nuance worth holding: on subscription SKUs the cost of a stockout is not a lost order, it is a churn event on a recurring revenue stream. Those genuinely deserve a higher service level than their revenue share suggests. The same logic applies to any SKU that is the first purchase in a high LTV sequence, which is why this connects directly to customer lifetime value rather than to gross margin alone.
Lead time variance is now the bigger half
The classic safety stock formula treats demand variance as the main enemy. For brands importing from Asia in 2026, that is no longer true. Sea-Intelligence put global liner schedule reliability at 62.2 percent in March 2026, with late vessels arriving an average of 5.48 days behind schedule (Sea-Intelligence). February 2026 was worse at 59.0 percent. Roughly four in ten containers arrive late, and when they do it is by the better part of a week.
Layer in customs. The US de minimis exemption has been suspended since August 2025 and remains suspended, with legislation permanently eliminating it in July 2027 (Supply Chain Dive, February 2026). Duty is now payable on shipments that used to clear free, which means the emergency air freight top-up that used to be a modest fix now carries a duty bill as well as a freight premium.
Two practical implications:
- Model lead time as a distribution, not a number. Record actual PO-to-available days for every shipment. Use the mean and standard deviation of that series, not the supplier's quoted lead time. Most brands discover their real variance is two to three weeks.
- Order timing beats order quantity. Placing the same order two weeks earlier is usually cheaper than buying more units, because it costs you two weeks of cash timing rather than a permanent increase in units on hand.
The tools, and when each is wrong
| Tool | Price | Best fit | When it is the wrong choice |
|---|---|---|---|
| Google Sheets | Free | Under ~150 SKUs, one supplier, one warehouse | Multi-location stock, bundles, component-level planning |
| Prediko | From $49/mo, tiered by GMV (pricing) | Shopify-native brands wanting forecasting plus PO workflow | You need deep ERP or wholesale channel logic |
| Fabrikatör | $99 to $199/mo by revenue band, plus $0.75 per backorder (app listing) | Brands that need backorder and pre-order to smooth demand | You want the tool to own financial planning too |
| Cogsy | $199/mo flat (app listing) | Up to 12 month horizons and what-if scenario planning | Very small catalogues where the price cannot be justified |
| Inventory Planner | Quote only | Larger catalogues, multi-channel, established ops teams | Early stage brands that want transparent pricing |
| Cin7 or Netsuite | Enterprise contracts | Real manufacturing, BOMs, wholesale plus D2C at scale | You are buying an ERP to fix a spreadsheet discipline problem |
Two honest observations about this category. First, every tool in it will produce a forecast whether or not your data supports one, and none of them will tell you the forecast is meaningless. Second, the biggest gain from buying software is usually not accuracy, it is that the purchase order workflow stops living in one person's head. That is a real gain, and it is worth $100 to $200 a month, but price it as workflow software rather than as a crystal ball.
If you are also running subscriptions, be careful about double counting. Recharge or Skio will project recurring orders, and your forecasting app will project them again from historical sales. We have seen brands overbuy 20 percent of a subscription SKU that way. Our Recharge to Skio migration walkthrough covers where subscription order data actually lives.
Measure bias before you chase accuracy
Forecast accuracy gets all the attention. Forecast bias is the thing that actually costs money, and it is much easier to fix.
Bias is the average signed error. If your forecasts are 8 percent high on average across 26 weeks, that is not noise, that is a systematic process fault, and it is compounding into your inventory position every single cycle. Accuracy without bias means you are wrong in both directions and your safety stock absorbs it. Accuracy with bias means you are steadily accumulating units or steadily stocking out.
Common bias sources in D2C, in rough order of frequency:
- Marketing plans included in the forecast at full planned spend, then spend gets cut mid-quarter. The forecast never gets revised down.
- Returns not netted out. NRF estimated 19.3 percent of online sales were returned in 2025 (NRF). On apparel it is higher. If resellable returns are not in the supply plan, you overbuy every cycle.
- New product forecasts anchored on the best previous launch rather than the median one.
- Stockout censoring. Weeks where a SKU was out of stock get counted as low demand weeks, which drags the forecast down and causes the next stockout. Shopify's own guidance flags this, citing research where accounting for stockouts removed almost all systematic demand underestimation (Shopify).
Track bias per SKU segment, monthly, on one chart. It is the highest return reporting you can add to a finance dashboard.
Our take
Conventional advice says to improve the model. We think that is usually the wrong first move, and here is the mechanism.
A forecast improvement only creates value if it changes a decision. In brands at this size, the buy quantity is set by a small number of hard constraints: the supplier MOQ, the container or pallet break, the cash available when the deposit is due, and the shelf life or seasonality window. Those constraints quantize the answer. If your MOQ is 5,000 units, a forecast that improves from 4,100 to 4,400 expected units changes nothing at all. You are still buying 5,000. The money you spent on better forecasting bought you a better number and the same purchase order.
So our position is that the highest return work is almost always constraint work, not model work. Negotiating the MOQ down from 5,000 to 2,500, even at a worse unit price, converts a lumpy annual bet into two smaller ones and roughly halves the cash tied up in that SKU at any moment. That is a real, immediate improvement in cash flow and it does not depend on predicting anything. The unit cost increase is usually cheaper than the carrying cost, the markdown risk and the opportunity cost of the cash combined, and yet it is rarely modelled that way because unit cost sits on the P&L where everyone can see it and the other three do not.
The second position we will defend: most brands should deliberately run lower service levels on the tail and accept the lost sales. The instinct is that a stockout is a lost customer. On a hero SKU, often true. On the fourteenth best selling variant, the customer usually substitutes or waits, and the cash you freed buys inventory or ad spend on something that compounds. Availability is not a virtue, it is a purchase, and it should compete with every other use of the same dollar.
Third, and this is where we disagree with most software vendors: do not buy a forecasting tool to fix a planning process you have not written down yet. The tool will encode whatever assumptions you were already making, faster and more confidently. Write the service level policy, the review cadence and the reorder rules in a document first. Then buy the tool that implements them. Doing it the other way round is how brands end up paying $199 a month for automated versions of the same mistakes.
What to do this week
- Pull 26 weeks of unit sales per SKU and compute coefficient of variation, then sort your catalogue into core, volatile, exposed and tail.
- Write a one page service level policy that assigns a target percentage to each segment, and get the founder or CFO to sign it.
- Record actual PO-to-available days for your last ten shipments and compute the mean and standard deviation. Replace the quoted lead time in your planning with the real distribution.
- Chart forecast bias by segment for the last six months. If any segment is consistently off in one direction, fix that before touching the model.
- Pick your top three SKUs by cash tied up and ask each supplier what a 50 percent lower MOQ would cost per unit. Compare that against carrying and markdown cost, not against unit price alone.
Demand planning at this stage is not a data science problem. It is a set of decisions about how much cash you are willing to convert into availability, made explicitly instead of by default. If you want a second pair of eyes on your buy plan, your service level policy or your inventory position going into peak, book a 30 minute call and bring the last two quarters of unit sales. If the work is broader than planning, a custom quote covers the operational and analytics build alongside it.
Frequently asked questions
Accurate enough that the buy decision does not change. Shopify suggests a 10 to 15 percent weekly margin of error as a practical starting point. Below that, extra accuracy rarely changes the purchase order quantity, because minimum order quantities and container sizes round the answer for you anyway.
Forecast demand at the product level, where signal is strongest, then split into variants using a rolling size or color mix. Variant-level history is noisy and produces wild swings. The exception is variants with genuinely independent demand, such as different scents or flavours with separate marketing.
Most D2C brands land between 95 and 97.5 percent on hero SKUs and 85 to 90 percent on the long tail. Going from 95 to 99 percent raises the safety stock multiplier from 1.65 to 2.33, roughly 40 percent more buffer cash, for four points of availability.
Under roughly 150 active SKUs with one supplier and one warehouse, a well-built sheet is usually enough and forces you to understand the math. Buy software when SKU count, multi-location stock, bundles or component level planning make manual maintenance the bottleneck.
They raise the cost of being wrong in both directions. Duty is now paid on landing, so overbuying ties up more cash per unit than it did in 2024, and small corrective air shipments carry duty too. Plan fewer, larger, better reasoned buys and hold the buffer in cash rather than in units.
Returns create a second, delayed supply stream. NRF put the 2025 online return rate at 19.3 percent of sales, so around one in five units sold comes back, and a meaningful share is resellable. Net that against demand or you will systematically overbuy on high return categories like apparel.
One-page resource
Get the Small Store Revenue Checklist.
The 12 things that actually move revenue on a store under $50K a month, in the order we'd fix them. Delivered to your inbox.