
Field notes
Customer Service as a Profit Center: D2C Math Nobody Models
July 29, 2026

A skincare brand doing $8M a year sat down to cut costs. Support was the obvious target: three full-time agents, a Gorgias Pro plan, a returns app, roughly $19,000 a month all in. Finance had it filed under general and administrative, next to accounting software. Nobody had ever divided it by orders.
When they did, the picture changed. Support was handling about 260 contacts per 1,000 orders. Just over a third of those were people asking where their parcel was, driven by a 3PL that had quietly slipped from two-day to five-day dispatch. Another fifth were customers trying to exchange a shade, hitting a returns portal that only offered refunds. The team was not overstaffed. It was absorbing the cost of two operational failures, in headcount, and calling that cost customer service.
That is the pattern. Support is the place where every upstream mistake in the business comes to be paid for in wages, and because it arrives as tickets rather than as a variance report, it never gets attributed back to the thing that caused it.
TL;DR
- Contact rate, not ticket count, is the metric. Contacts divided by orders shipped is the only figure that survives growth.
- Support absorbs the cost of upstream failures. Reason-code your tickets and most of your volume traces back to fulfillment, PDP information gaps, or a returns flow that forces a refund when the customer wanted an exchange.
- Deflection and prevention are different strategies with different economics. Gartner found only 14% of service issues are fully resolved in self-service, so a deflected ticket is often a churned customer.
- Per-resolution AI pricing means your automation bill grows with your failure rate. That is the wrong incentive to buy into before you have done prevention work.
- The loyalty payoff is in effort, not delight. Gartner's data ties low-effort resolution to a materially higher probability the customer stays.
The line item that does not exist in your P&L
Open the management accounts of most brands between $2M and $20M and you will find support wages under G&A, helpdesk software under software subscriptions, returns shipping under fulfillment, and goodwill discounts buried inside gross revenue as a contra. Four different places, none of them adding up, none of them divided by orders.
The result is that no one can answer a simple question: what does it cost us to serve one order after we have shipped it?
Build that line. Post-purchase cost per order is fully loaded support wages, plus helpdesk and returns tooling, plus return shipping and restock labor, plus the cost of goods on reships, plus the margin given away in service discounts, divided by orders shipped in the period. Track it monthly. Put it next to contribution margin in your finance dashboard. It will be a larger number than anyone at the table guessed, and unlike CAC it is almost entirely within your control.
Contact rate is the metric, not ticket count
Ticket count is a vanity denominator. It rises with orders, so a growing brand always looks like it needs more agents.
Contact rate is contacts divided by orders shipped. It is a rate, so it is comparable across months, across product launches, and across a peak season. If contact rate is flat while orders grow, your support cost is a fixed percentage of revenue forever and every dollar of new revenue carries that tax. If contact rate falls while orders grow, you are compounding.
Then split it by reason. Not by channel, not by agent, by reason. Order status. Delivery exception. Sizing or fit. Product question that should have been answered on the PDP. Returns and exchanges. Damaged or wrong item. Subscription changes. Payment failures.
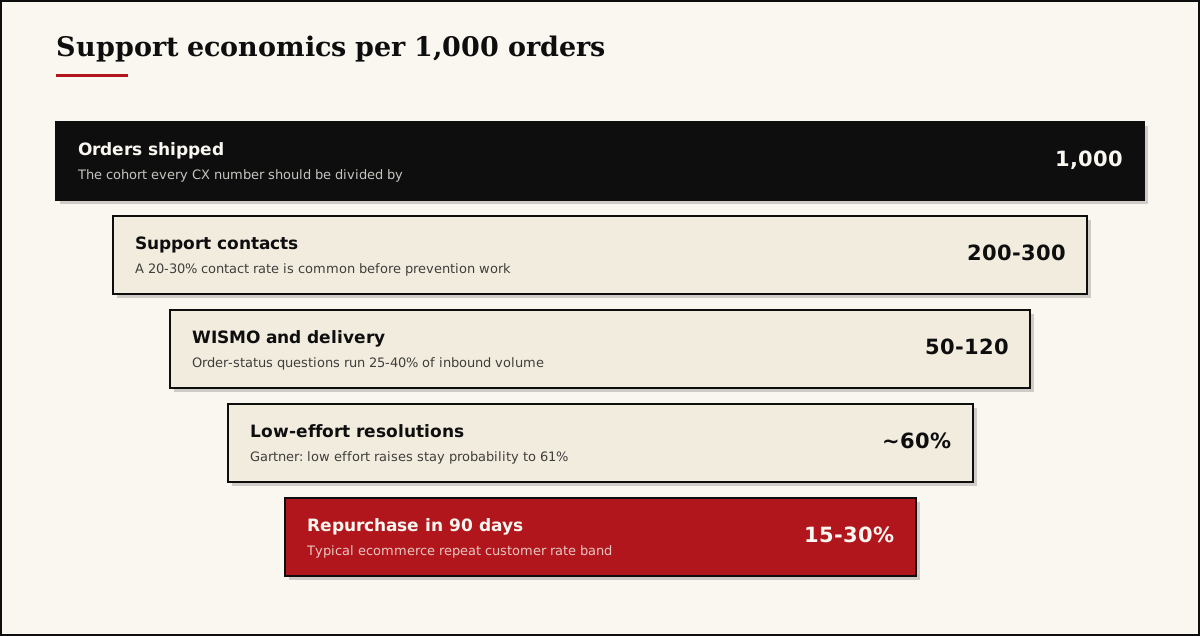
Order-status questions, the ones the industry calls WISMO, routinely account for a quarter to two-fifths of inbound ecommerce volume and climb higher in peak weeks. Every one of those is a symptom, not a workload. The customer is not confused about your brand. They are anxious about a parcel, and they are anxious because your tracking communication is worse than the fulfillment reality or the fulfillment reality is genuinely bad. Neither is fixed by hiring.
What a contact actually costs
Published ecommerce cost-per-contact benchmarks land in a wide band by channel, and the spread is the point. One 2026 benchmark set puts phone at $17 and up per contact, live chat at $10 to $16, email at $8 to $15, self-service at $1 to $4, and AI-handled contacts under $2, and cites Gartner's median figures of $1.84 for self-service against $13.50 for assisted channels (Ringly benchmark set).
Use those as a sanity check, not as your number. Build your own from your own payroll and your own average handle time. Then add the parts that never show up in helpdesk reporting.
| Cost component | Where it usually hides | Why it belongs in CX |
|---|---|---|
| Agent wages and benefits | G&A | The visible half of the cost |
| Helpdesk and AI resolution fees | Software subscriptions | Scales with contact volume, not headcount |
| Return shipping and restock labor | Fulfillment | Triggered by a service event |
| COGS on reships and replacements | COGS, unattributed | Pure margin loss from a service failure |
| Goodwill discounts and refunds | Contra revenue | The price of buying your way out of a bad experience |
| Chargebacks and disputes | Payment processing | Almost always a support failure first |
Once those six sit in one place, the argument about whether to hire a fourth agent stops being a headcount argument and becomes a margin argument, which is a better argument to have.
The revenue side, and how to measure it honestly
Support platforms have made revenue attribution easy and slightly misleading. Gorgias attributes a sale to a ticket when the customer purchases within three days of the ticket being created, and surfaces that as revenue generated by support (Gorgias revenue statistics). That is a useful operational signal. It is not causal evidence, because a customer who contacts you is already a customer with intent.
The honest measurement is cohort-based. Take everyone who contacted support in a month. Take a matched set who ordered in the same month and did not contact support, similar AOV, similar category. Compare 90-day repeat purchase rate and 12-month revenue per customer. That comparison tells you whether your support function is retaining people or leaking them, and it does not depend on any vendor's attribution window.
The mechanism behind why this matters is well documented. Gartner's research found that customers who have a low-effort service experience are 61% more likely to stay with the company, against 37% for a high-effort experience, and that service interactions which add value push the stay probability higher still (reported figures). Note what that is not. It is not about delight, surprise gifts or handwritten notes. It is about how hard the customer had to work. Effort is the variable.
Repeat customers carry disproportionate revenue weight in ecommerce, with typical repeat customer rates clustering in the 15% to 30% band and the repeat cohort contributing a much larger share of revenue than its share of customers (Shopify retention benchmarks). If your support experience moves a few points of that band, it is doing more for contribution margin than most creative tests. Pair this with your LTV model rather than treating it as a separate conversation.
Deflection versus prevention
These get used interchangeably and they are opposites.
Deflection means the contact happens and you route it away from a human. Prevention means the contact never happens.
Deflection has a real ceiling. Gartner's 2024 survey of 5,728 customers found only 14% of customer service issues are fully resolved in self-service, and that most journeys starting in self-service end up in another channel anyway (Gartner press release). Meanwhile 75% of CX leaders expect most interactions to be resolved without human intervention in the near future (Zendesk CX Trends 2025). Those two facts sitting next to each other should make you cautious about buying the second one before you have measured the first.
Prevention is unglamorous and it works. A tracking page that updates before the customer wonders. Dispatch SLAs your 3PL actually hits, which is a 3PL problem rather than a CX problem. Fit and sizing information on the PDP where the doubt actually forms. A post-purchase email sequence that answers the three questions your reason codes say people ask. An exchange path that does not require a conversation.
The economics differ sharply. Prevention costs engineering and operations time once and then reduces volume permanently. Deflection costs a per-resolution fee every single time, forever, and the bill grows in exact proportion to how often you disappoint people.
The stack, and when each tool is the wrong choice
| Tool | Public price | Best fit | Wrong choice when |
|---|---|---|---|
| Gorgias | $60/mo for 300 tickets, $360/mo for 2,000, overage around $0.36 to $0.40 per ticket, AI Agent from $0.90 per resolution (pricing model, plan detail) | Shopify-native brands who want unlimited seats and deep order actions inside the ticket | Volume is spiky and unpredictable, so ticket-metered pricing punishes your bad months hardest |
| Zendesk Suite | Team $55/agent/mo, Professional $115/agent/mo annual, Copilot add-on $50/agent/mo (Zendesk pricing) | Multi-brand, multi-region, or where governance and reporting depth matter | You are a five-person team on one Shopify store, where you will pay for enterprise scaffolding you never use |
| Richpanel | Around $0.20 per AI-resolved conversation (Richpanel comparison) | High-volume, high-repetition inboxes where automation rate is genuinely high | Your tickets are complex or emotional, where a low per-resolution price simply buys you more bad resolutions |
| Loop Returns | Essential $155/mo, Advanced $272/mo, plus negotiated volume terms (Loop pricing) | Apparel and any category where exchange-first flows can convert refunds into retained revenue | Return rate is genuinely low, where a spreadsheet and a Shopify draft order still beats a subscription |
| Postscript / SMS | Per-message, varies by carrier fees | Proactive delivery and exception notices, which is where SMS earns its keep | Used as another promotional channel while WISMO tickets go unanswered |
The pattern worth noticing: three of these five are priced on your failure rate. Tickets, AI resolutions and returns are all volumes you would prefer to shrink. Any vendor whose revenue grows when your operations degrade is a vendor whose roadmap will not prioritize prevention. That is not a reason to avoid them. It is a reason to own the prevention work yourself.
Returns are a CX line, not a logistics line
NRF put total US returns at $849.9 billion in 2025, a 15.8% return rate overall and 19.3% for online sales, with 9% of returns judged fraudulent (NRF 2025 Retail Returns Landscape).
Read that as a support forecast, not a warehouse forecast. Roughly one in five online orders generates a return event, and a return event is a contact, a refund decision, a shipping cost, a restock cost and a fork in the retention path. It is the single highest-leverage moment in the post-purchase experience because the customer is already talking to you and already deciding whether to come back.
Returns also cost you before the sale. Baymard's meta-analysis of 50 studies puts documented cart abandonment at 70.22%, with an unsatisfactory returns policy cited by 13% of abandoning shoppers and extra costs including shipping cited by 40% (Baymard). Tightening the returns window to protect margin is therefore a conversion decision as much as an operations one, which is why we treat returns policy as a CRO surface and handle returns abuse separately rather than punishing everyone for it.
Our take
Most agencies will tell you to buy an AI agent and cut your support headcount. We think that is usually the second move and almost never the first, and here is the mechanism.
Automation prices your failures. If 30% of your contacts are WISMO caused by a 3PL missing dispatch SLAs, an AI agent resolves those beautifully and charges you roughly a dollar a time to keep resolving them, month after month, while the underlying dispatch problem stays invisible because the tickets stopped hurting. You have converted a fixable operational defect into a permanent variable cost and removed the pain signal that would have made you fix it. That is a worse position than being annoyed by tickets.
So the order we run it in is: reason-code, then prevent, then automate the residual. Thirty days of coded tickets almost always shows that 50% to 70% of volume traces back to a handful of upstream causes. Fix those and the remaining volume is genuinely conversational: fit advice, product selection, edge cases, complaints. That residual is where automation earns its price, and it is also where a human is worth paying for, because that is where the loyalty effect lives.
The second thing we will disagree with conventional wisdom on: stop chasing CSAT. CSAT measures whether the person who bothered to reply liked the agent. It is heavily biased toward people who were already inclined to like you, and it moves when you change survey timing. Effort and resolution are better instruments. Track first-contact resolution, contacts per resolved issue, and post-contact 90-day repeat rate. Those three tell you whether your support function is a cost or a margin engine. CSAT tells you your agents are polite, which they probably are.
Third, and least popular with founders: your support inbox is the highest-signal product research you own and you are almost certainly not reading it. Sizing complaints are a PDP brief. Repeated "does this work with" questions are a bundle opportunity. Delivery anxiety is a checkout and shipping messaging brief. A weekly 30-minute read of raw tickets by whoever owns merchandising will outperform most customer surveys you could commission.
What to do this week
- Build one post-purchase cost per order figure from wages, tooling, return shipping, reship COGS and goodwill discounts, and put it beside contribution margin.
- Turn on reason codes in your helpdesk and force every ticket to be tagged, then read the distribution after 30 days rather than guessing at it now.
- Pull a cohort comparison of 90-day repeat rate for customers who contacted support against a matched set who did not, and see which direction the gap points.
- Take your top reason code and fix the upstream cause instead of the ticket, whether that is a 3PL SLA, a tracking page, or three missing lines on a PDP.
- Audit what your per-resolution and per-ticket vendors will cost at next year's order volume if your contact rate does not move.
If you want a second pair of eyes on the numbers before you commit to a new tool or a new hire, book a 30-minute call and bring 30 days of tagged tickets. We will model contact rate, cost per contact and the retention gap with you. If you already know the shape of the work and want it scoped, request a custom quote, or start with a free audit of the post-purchase surfaces that generate most of your volume.
Frequently asked questions
There is no universal number because category and AOV change it. What matters is the trend on your own store. Measure contacts divided by orders shipped, weekly, split by reason code. If that ratio is flat while orders grow, your support cost scales linearly with revenue and you have a structural problem, not a staffing one.
Neither, until you have reason-coded 30 days of tickets. If order status and delivery questions dominate, the cheapest fix is proactive shipping communication and a better tracking page, not a per-resolution AI bill. Buy automation for the residual volume that survives prevention work.
Gorgias attributes a sale to a ticket when the customer buys within three days of the conversation opening. Treat that as directional, not causal. The stronger measure is cohort based: compare 90-day repeat rate for customers who contacted support against those who did not, holding order value and category constant.
No. Volume falling because customers gave up is a churn event disguised as an efficiency win. Track resolution rate and post-contact repeat rate alongside volume. Gartner found only 14% of service issues are fully resolved in self-service, so deflected does not mean solved.
Published ecommerce benchmarks put agent-handled contacts in the region of $8 to $17 depending on channel, with phone the most expensive and self-service an order of magnitude cheaper. Your own number should be fully loaded: wages, tooling, refunds issued, reship cost and the margin on goodwill discounts.
Returns are a CX line, not a logistics line. NRF put the 2025 online return rate at 19.3%. Every return is a contact, a refund, a restock cost and a retention fork, which is why exchange-first flows and better PDP information usually beat squeezing the refund window.
One-page resource
Get the Small Store Revenue Checklist.
The 12 things that actually move revenue on a store under $50K a month, in the order we'd fix them. Delivered to your inbox.