
Field notes
Contribution Margin by SKU: The P&L View D2C Brands Skip
August 4, 2026

A brand doing $9M a year reports 62 percent blended gross margin. The board deck says the model works. Then someone exports twelve months of order lines, allocates freight by actual parcel weight, subtracts payment fees, nets out discounts at the line level rather than the order level, and charges each return back to the SKU that caused it. The 62 percent turns out to be an average sitting on top of a range that runs from 71 percent down to negative 4 percent. Two SKUs in the top ten by units are net cash-negative once reverse logistics are counted. Both are heavily featured in paid social because they have the lowest cost per acquisition.
That is the shape of the problem. The brands that hit a growth wall around $5M to $15M rarely have a traffic problem or a creative problem. They have an allocation problem. Every dollar of ad spend, every merchandising slot on the homepage, every unit of inventory capital gets pushed toward products that look efficient in the acquisition dashboard and destroy contribution in the P&L. Nobody notices, because the P&L is only ever read at the top level, and the top level is an average.
Contribution margin by SKU is the view that resolves it. It is not hard analysis. It is unglamorous, it takes a week, and almost nobody builds it.
TL;DR
- Blended gross margin is an average that conceals a distribution. The interesting information is in the spread, not the mean.
- Shopify's built-in profit reporting subtracts cost per item and nothing else, and cost per item is stored as a static value, so the report drifts and understates true unit cost.
- The four costs that flip a SKU from profitable to unprofitable are outbound freight, returns and reverse logistics, discount depth, and payment processing. All four vary enormously by SKU and none are in your gross margin.
- Keep paid media out of the SKU calculation. Attribution at unit level is not reliable enough to bear the weight of an assortment decision.
- The output is not a report. It is four decisions: reprice, re-merchandise, bundle, or delist.
Blended gross margin is an average, and averages hide distributions
If you sell 400 SKUs and report one gross margin number, you are reporting the weighted mean of 400 different economics. Two portfolios with an identical 62 percent blended margin can be completely different businesses. One has a tight distribution between 55 and 68 percent. The other has a fat tail of loss-making SKUs subsidised by a handful of heroes.
The second portfolio is far more common, because SKU counts only ever go one direction. McKinsey documented a consumer goods company that grew SKU count by 66 percent over three years and saw a 40 percent decline in sales per SKU alongside a 10 percent margin reduction, in research on portfolio complexity in consumer goods. The mechanism is not mysterious. Nobody in a growing brand is incentivised to kill a product. Launches get celebrated, discontinuations get argued about, and the tail accumulates.
The tail is not evenly bad, either. It is usually bad in a specific, structural way: heavy items, bulky items, items with high size or colour variance, items sold mainly on discount. Those four characteristics map almost perfectly onto the four costs your gross margin ignores.
What Shopify actually gives you, and where it stops
Shopify's profit reports subtract cost of goods sold from net sales. Shopify's own documentation is explicit about the constraints: the cost per item field contains static data, so profit reports are only relevant to a specific point in time, and profit is reported only for products that had a cost recorded at the moment they were sold. Anything sold before you backfilled costs is silently excluded, which is why the profit report total rarely reconciles to the sales report total.
Two consequences matter operationally.
First, if your supplier raised prices in March and someone updated cost per item in June, every unit sold in between is reported at the old cost. Your margin looked better than it was for a quarter.
Second, cost per item is a single field. There is no separate line for inbound freight, duty, tariff, inspection, or the cost of the mailer the unit ships in. Most brands stuff landed cost into that one field, which is correct, but then never revisit it when freight rates or duty rates change.
Shopify is not doing anything wrong here. It is a commerce platform reporting what it can defensibly know. The gap between "cost per item" and "what this unit actually costs us to sell" is your job.
The five variable cost lines that belong in a SKU model
| Cost line | Typical driver | Where the data lives | Why it varies by SKU |
|---|---|---|---|
| Landed product cost | Supplier price, inbound freight, duty, tariff | Purchase orders, customs entries, supplier invoices | Order quantity, origin country, HS code |
| Outbound freight | Billable weight, zone, dimensional rules | Carrier invoices, 3PL statements | Weight and cube differ by an order of magnitude across a catalog |
| Pick, pack and materials | Units per order, packaging spec | 3PL invoice detail | Fragile or oversized items need custom packaging |
| Payment and platform fees | Order value, gateway, plan tier | Payout reports, Shopify billing | Higher AOV SKUs carry more percentage-based fee |
| Returns and reverse logistics | Return rate, refund value, disposition | Returns platform, RMA data | Apparel fit returns versus consumables |
Discounts are the sixth and they behave differently, so they get their own treatment below.
Outbound freight is where most models fall apart, because brands allocate it as a flat per-order average. That single choice is what conceals the heavy-item problem. A 6oz supplement and a 3lb ceramic planter do not cost the same to ship, and dimensional weight rules mean the planter can cost more than its actual weight suggests. Both UPS and FedEx announced average general rate increases of 5.9 percent for 2026, the third consecutive year at that headline number, with individual surcharges rising by different amounts, so the gap between light and heavy SKUs widens every year even if you change nothing.
Returns are the second failure point. The NRF's 2025 Retail Returns Landscape puts the online return rate at an estimated 19.3 percent of sales, with 9 percent of all returns fraudulent. A brand-level average of 19 percent is not the useful number. The useful number is that a fitted apparel SKU might return at 35 percent while a candle returns at 2 percent, and that difference alone can be 15 points of contribution margin. If you are still writing your policy around this, our returns policy guide covers the customer-facing side, and the returns fraud piece covers abuse patterns. This article is about charging the cost back to the product that generated it.
Discounts: allocate at the line, not the order
This is the single most common modelling error we see, and it is worth its own section.
A customer buys three items and applies a 20 percent site-wide code. Most models take the order-level discount and spread it evenly across the three lines. That is arithmetically tidy and analytically wrong when the discount is not uniform, when a tiered threshold triggered it, or when one SKU is the one that always appears in discounted carts.
Do it properly and a pattern usually appears: a small number of SKUs carry a much higher effective discount rate than the catalog average, because they are the ones featured in promotions, the ones used as the entry offer, or the ones customers add to hit free shipping thresholds. Their list margin looks fine. Their realised margin does not. Shopify's documentation confirms discounts and refunds reduce net sales and therefore reported gross margin, which means your reported margin is already discount-inclusive at the aggregate level but not attributable at the SKU level.
Add the free shipping threshold to this. If a SKU is frequently the last item added to reach a $75 threshold, it is doing real work in raising AOV, and its own contribution margin will read worse than its portfolio value. That is not a reason to ignore the number. It is a reason to hold two numbers: standalone contribution and cart-context contribution.
Building the model: three levels of effort
Level one is a spreadsheet. Export twelve months of order line items from Shopify, join to a cost table you maintain by SKU, join to a freight table by weight band and zone from your carrier or 3PL invoices, apply your payment fee rate, apply an actual per-SKU return rate from your returns platform, and compute contribution dollars and contribution percentage per SKU. A competent analyst does this in three to five days. It answers the question once, which is often enough to change three decisions.
Level two is an app. This gets you a recurring view without a person rebuilding it.
Level three is a warehouse model. BigQuery or Snowflake, Shopify and carrier and returns data loaded, dbt models producing a SKU-level contribution table, feeding whatever BI tool you already use. This is correct at $20M and overkill at $3M. Our DTC finance dashboard piece covers what sits on top of that pipeline.
Tools, honestly compared
| Tool | Price | Best at | Wrong choice when |
|---|---|---|---|
| Shopify profit reports | Included | Fast COGS-only margin sanity check | You need freight, returns or fee allocation, or historical accuracy |
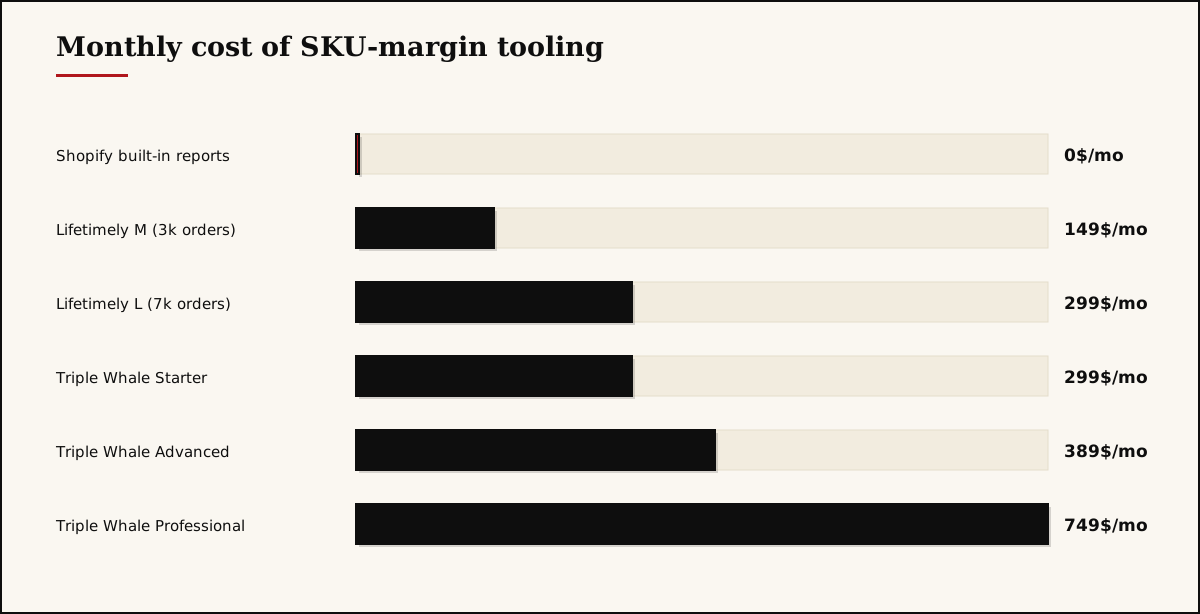
| Lifetimely by AMP | Free to 50 orders/mo, then $79 (500 orders), $149 (3k), $299 (7k); Amazon data +$75 | Daily P&L and product profit for lean teams | You need custom cost logic or your freight rules are unusual |
| Triple Whale | Free tier, Starter $299, Advanced $389, Professional $749 | Attribution plus product analytics in one surface | You want margin only and have no paid media complexity to justify the price |
| Polar Analytics | Demo-gated, GMV-based | BI-style flexible reporting on commerce data | You need published pricing before a sales call |
| Warehouse plus dbt | Compute cost plus build time | Full control, joins to anything, no per-order ceiling | Nobody on the team owns SQL models after launch |
A note on the fee line, because it is small but real. Shopify charges a third-party gateway fee if you do not use Shopify Payments, and Shopify's pricing page lists it at 2 percent on Basic, 1 percent on Grow, 0.6 percent on Advanced and 0.2 percent on Plus, on top of whatever your gateway charges. On a low-margin SKU, moving from Basic to Grow is a margin decision, not an IT one.
The four decisions the model produces
A contribution margin table is worthless as a report. It is only worth building if it triggers action. There are four actions.
Reprice. The cleanest fix for a SKU with positive but thin contribution and inelastic demand. You are usually closer to the price ceiling than you think on hero products and further from it on tail products nobody price-compares.
Re-merchandise. If a high-contribution SKU is buried on page three of a collection while a low-contribution SKU owns the homepage hero, you have a free margin gain with no cost change. Same for which products your paid creative features and which appear in flows.
Bundle. A weak SKU with strategic value (it drives repeat, it completes a routine, it is the gift item) belongs inside a bundle where blended contribution works, not alone on a PDP. See our bundles guide for the mechanics.
Delist. The hardest one, because someone loved that product. The test is not whether it is profitable. It is whether the working capital, the warehouse slot, the photography, and the operational attention it consumes would earn more elsewhere.
Where SKU-level margin will mislead you
Be honest about the limits, because a model applied without judgement does damage.
It ignores acquisition role. A tripwire product with 8 percent contribution margin that reliably converts new customers into a subscription is not a bad SKU, it is a customer acquisition cost with inventory attached. Judge it against customer lifetime value, not against its own line.
It ignores basket halo. Some SKUs rarely sell alone. Kill them and you lose orders, not just their revenue. Before delisting anything, check what percentage of its orders contain it as the only item.
It ignores fixed cost absorption. Contribution margin is pre-overhead by design. If you cut 30 percent of the catalog you do not cut 30 percent of your fixed cost base, and the remaining SKUs must now carry it.
It rewards short time horizons. A SKU in month two of launch carries launch inefficiency: small production runs, unamortised tooling, high return rates from customers who have not learned the fit. Give new products a defined grace period and judge them at the end of it, not continuously.
Our take
Most agencies and analytics vendors will tell you to push everything down to SKU level, including ad spend. We think that is wrong, and we will argue the mechanism rather than just assert it.
Ad spend does not buy units, it buys carts. The unit of decision at the campaign level is a customer, not a SKU, and the attribution required to split spend across the lines inside a cart is an estimate stacked on an estimate. When you push a soft number into a hard model, the model inherits the softness but keeps the appearance of precision. You then make an irreversible assortment decision, delisting a product, on a number with an error bar wider than the differences you are comparing. That is worse than not having the model.
So we run it the other way. SKU contribution margin uses only costs that are invoiced: supplier invoices, carrier invoices, 3PL statements, payout reports, RMA records. Every input can be tied to a document. That model then produces a defensible contribution dollar total, and media efficiency gets judged one level up against that total using MER rather than platform ROAS. Hard numbers at SKU level, honest estimates at portfolio level, and never the reverse.
The second thing we will disagree with is the reflex to fix a thin-margin SKU by cutting product cost. Renegotiating with a supplier is slow, usually requires volume commitments you may not want, and yields a few points at best. The freight, returns and discount lines are almost always the bigger opportunity, and you control all three unilaterally. Repackaging a product to drop a dimensional weight band, tightening the size guidance on a high-return SKU, or removing one product from your standard promotional rotation can each move contribution margin more than a year of supplier negotiation, and they can be done this quarter. If freight is your worst line, the 3PL transition playbook is the next read.
The third position: build the spreadsheet before you buy the app. The value of this exercise is concentrated in the first run, when you discover which assumptions were wrong. Buying a $389 per month tool before you know what you are looking for gets you a dashboard nobody opens. Prove the insight manually, identify the three cost lines that actually moved the answer, then automate those.
What to do this week
- Export twelve months of Shopify order line items with discounts, refunds and shipping, and pull matching carrier or 3PL invoice detail for the same period.
- Build a per-SKU return rate from your returns platform rather than applying a single brand-wide average.
- Allocate outbound freight by weight band and zone, not as a flat per-order figure, and rerun the top 50 SKUs by units.
- Rank every SKU by contribution dollars and by contribution percentage, then list the ten where the two rankings disagree most. Those are your decisions.
- Audit cost per item in Shopify against your last three supplier invoices and note the date each cost was last updated.
If you want a second pair of eyes on the model, or you would rather have it built properly the first time, book a 30 minute call and bring your last twelve months of order data. We will tell you within the call whether the answer is a repricing exercise, a freight exercise or an assortment exercise. If the scope is clear already, request a custom quote, and if you want the storefront side reviewed at the same time, start with a free audit.
Frequently asked questions
Gross margin subtracts only landed product cost from net sales. Contribution margin also subtracts every other variable cost that moves with the unit: outbound freight, pick and pack, payment processing, discounts, returns and reverse logistics, and any per-unit app fee. It is the number that tells you whether selling one more unit adds cash.
No. Contribution margin is deliberately pre-overhead. Salaries, rent, software subscriptions and agency retainers do not change when you sell one more candle, so allocating them to SKUs produces a number that misleads pricing and assortment decisions. Keep fixed costs at the P&L level where they belong.
Keep it out of the SKU line and hold it one level up. Attribution at SKU level is unreliable and most ad spend drives a cart, not a unit. Run SKU contribution margin first, then compare the blended contribution dollars against total media spend using MER rather than pushing spend down to individual products.
Monthly is the right cadence for most brands in the $2M to $20M range, with a fuller rebuild each quarter when freight tables, supplier prices and app fees change. Shopify stores cost per item as a static value, so anything built on it drifts unless someone owns the refresh.
Start with the biggest components you can evidence: supplier invoice price, inbound freight and duty allocated by unit or by cubic volume. A model that is directionally right on 90 percent of your revenue beats a perfect model that never ships. Refine the tail later.
A spreadsheet is enough to answer the question once. An app or warehouse model is what you need to keep answering it every month without a person rebuilding it. Most brands should prove the insight in a spreadsheet first, then automate only the parts that changed a decision.
One-page resource
Get the Small Store Revenue Checklist.
The 12 things that actually move revenue on a store under $50K a month, in the order we'd fix them. Delivered to your inbox.